EconomyNews
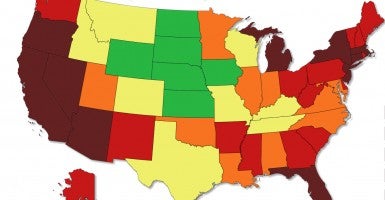
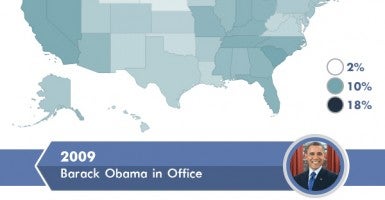
38 Years of Your State’s Unemployment Data Displayed in One Map
A new map—presented as a GIF—is putting unemployment rates in historical context. Courtesy of Metric Maps, the image shows how unemployment rates have changed state-by-state from 1976 to… Read More