The latest unemployment report released this month revealed rare “good news” about the U.S. labor market. The 6.1 percent unemployment rate marked an all-time low since the 2008 recession.
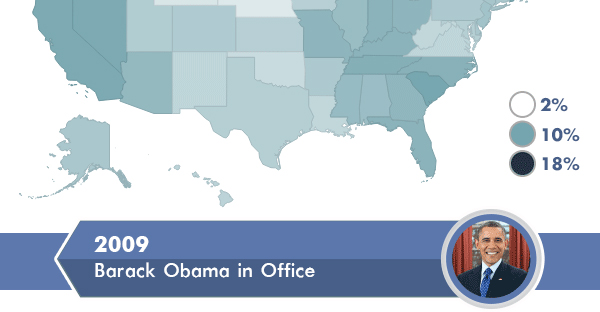
Although June’s report indicates an encouraging sign for the job market, that hasn’t always been the case under President Obama. A series of interactive maps—from Jimmy Carter’s presidency through Obama’s—illustrate the ever-changing unemployment rates under the past six presidents.
Jimmy Carter (1977-1981)
Ronald Reagan (1981-1989)
George H.W. Bush (1989-1993)
Bill Clinton (1993-2001)
George W. Bush (2001-2009)

Barack Obama (2009-present)